Note
Click here to download the full example code
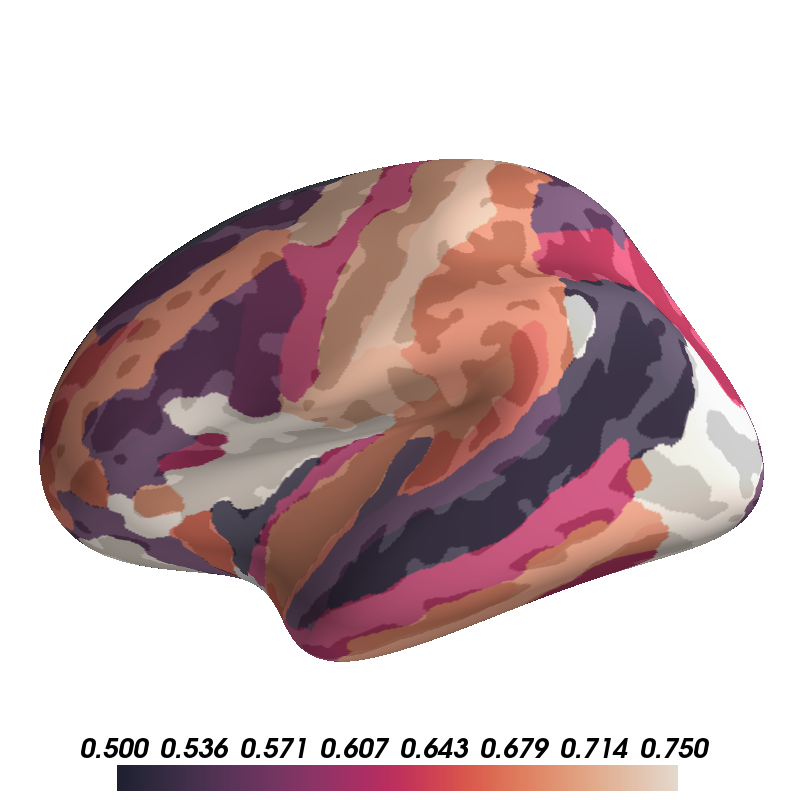
Display ROI Values
Here we demonstrate how to take the results of an ROI analysis performed within each region of some parcellation and display those values on the surface to quickly summarize the analysis.
Out:
colormap sequential: [5.00e-01, 6.25e-01, 7.50e-01] (opaque)
import os
import numpy as np
import nibabel as nib
from surfer import Brain

print(__doc__)

subject_id = "fsaverage"
hemi = "lh"
surf = "inflated"

"""
Bring up the visualization.
"""
brain = Brain(subject_id, hemi, surf, background="white")

"""
Read in the automatic parcellation of sulci and gyri.
"""
aparc_file = os.path.join(os.environ["SUBJECTS_DIR"],
                          subject_id, "label",
                          hemi + ".aparc.a2009s.annot")
labels, ctab, names = nib.freesurfer.read_annot(aparc_file)

"""
Make a random vector of scalar data corresponding to a value for each region in
the parcellation.

"""
rs = np.random.RandomState(4)
roi_data = rs.uniform(.5, .8, size=len(names))

"""
Make a vector containing the data point at each vertex.
"""
vtx_data = roi_data[labels]

"""
Handle vertices that are not defined in the annotation.
"""
vtx_data[labels == -1] = -1

"""
Display these values on the brain. Use a sequential colormap (assuming
these data move from low to high values), and add an alpha channel so the
underlying anatomy is visible.
"""
brain.add_data(vtx_data, .5, .75, thresh=0, colormap="rocket", alpha=.8)
Total running time of the script: ( 0 minutes 0.636 seconds)